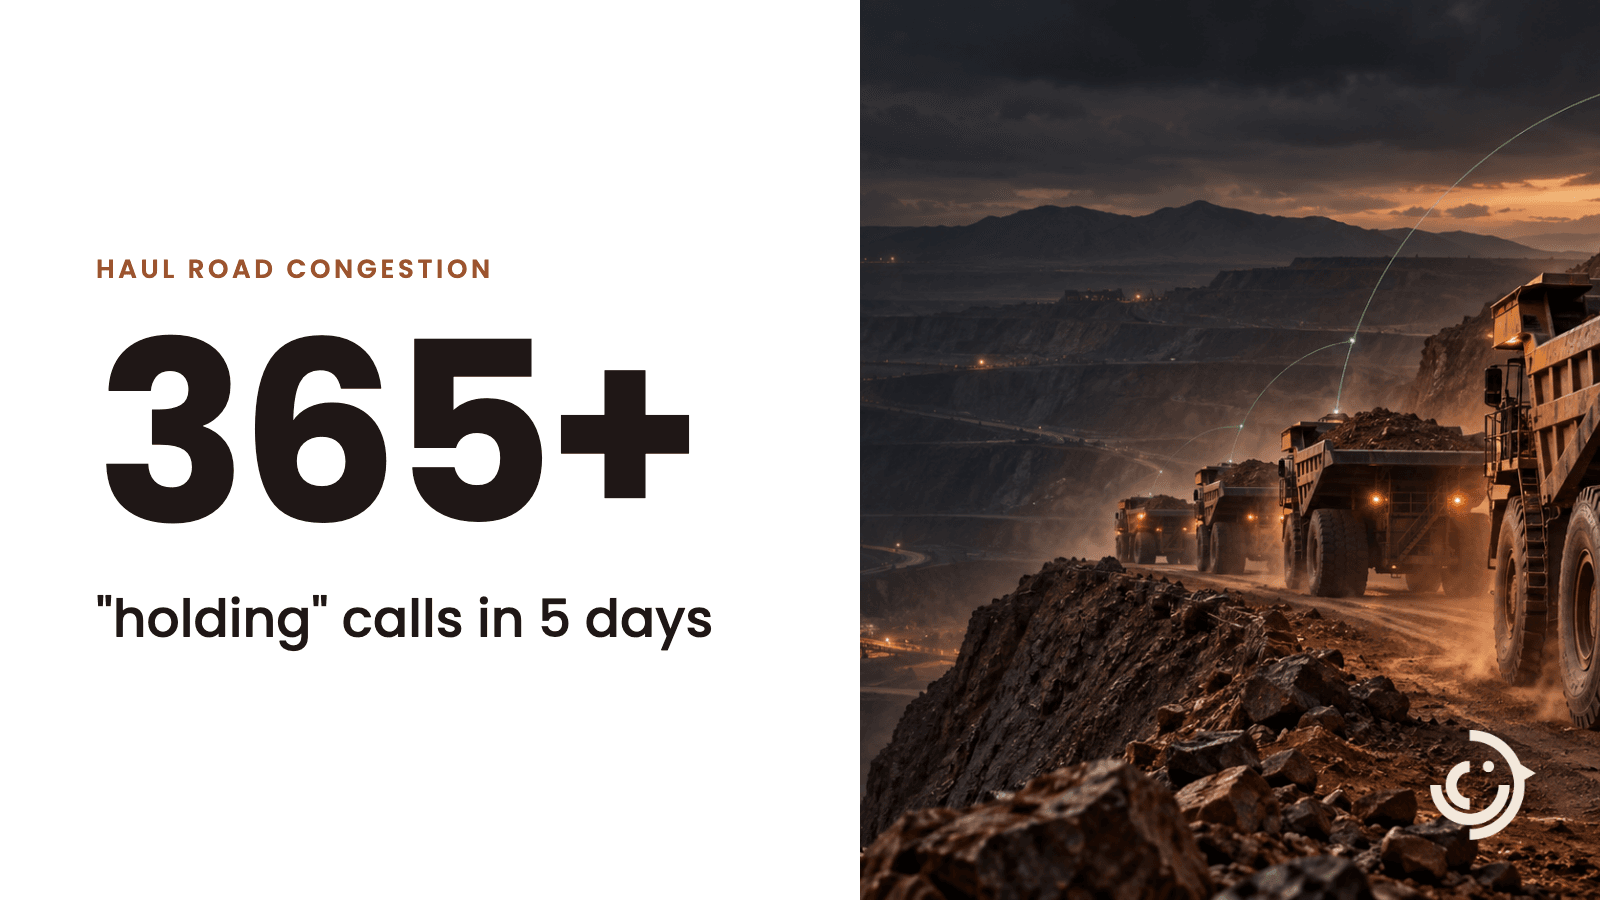
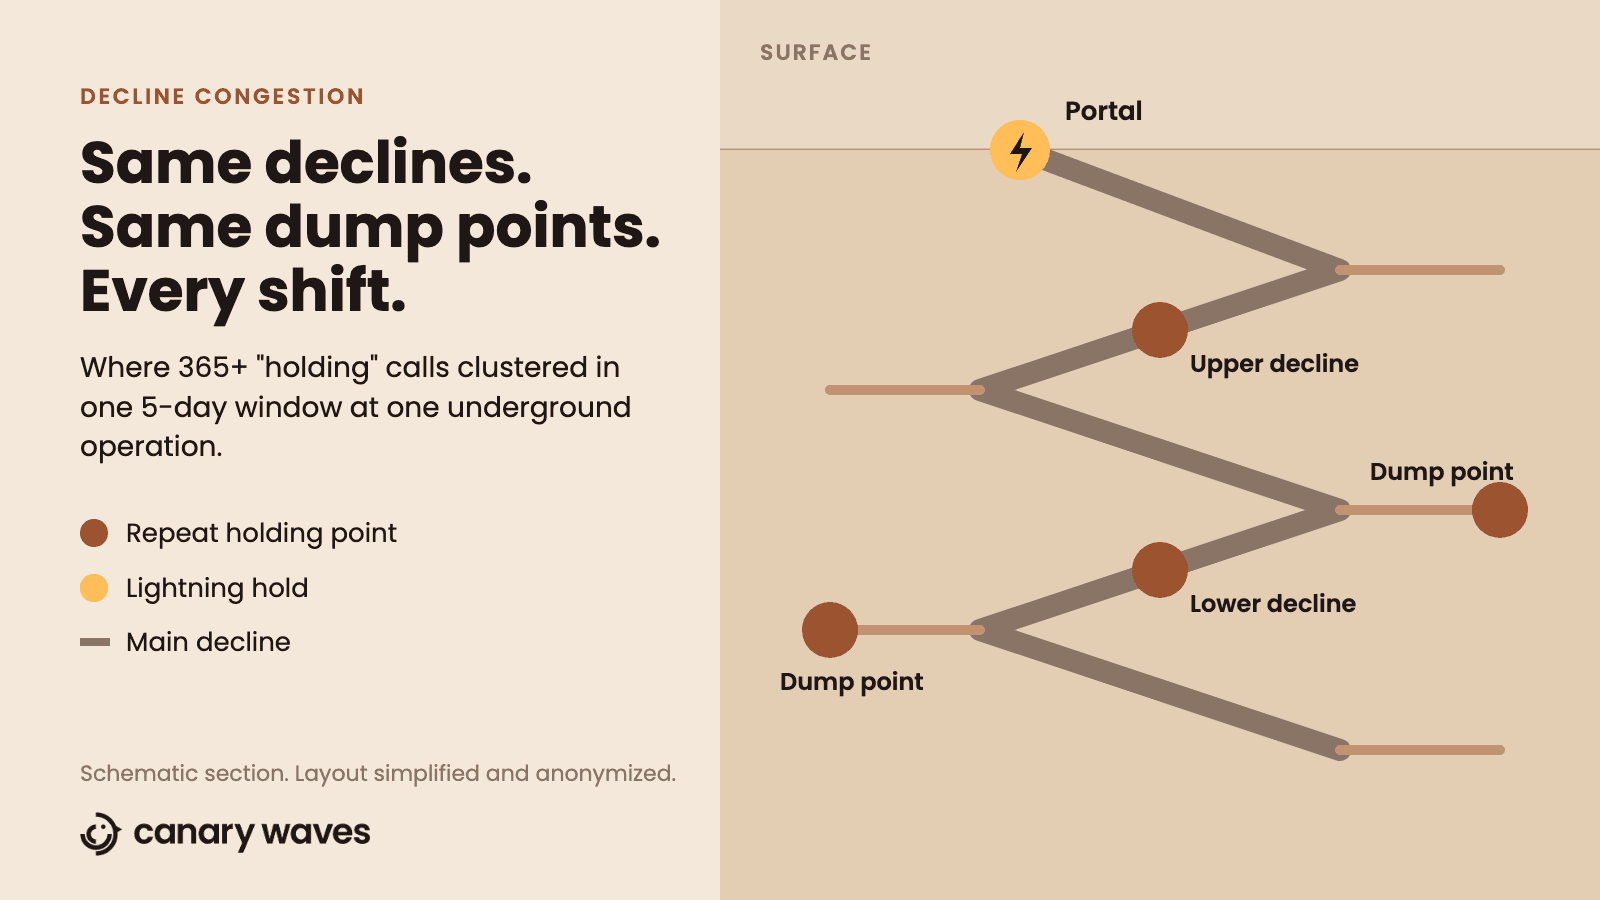
In one 5-day window at one underground operation, the word "holding" crossed the radio more than 365 times. "Holding." "Still holding." "Hold at the decline." Each call on its own was routine. Together they were a map of haul road congestion. The holds landed at the same declines and the same dump points, shift after shift, and pointed straight at the operation's bottlenecks.
None of it was hidden. It was said on the open channel, hundreds of times, but a busy radio channel does not keep a tally. This post is about what those calls tell you, why they matter for safety as much as for tonnes, and how to turn them into a bottleneck map without waiting for a study.
Why haul road congestion matters beyond throughput
Holds are usually filed under productivity. A truck standing at the top of a decline is a truck not moving dirt, and the cost shows up in cycle times and tonnes per hour. That framing is right, but it is only half the picture.
Some queuing is normal. A 2014 AusIMM paper, Is Truck Queuing Productive?, used discrete event simulation to show that the fleet size that maximizes productivity and value still leaves some trucks queuing at shovels on average, once you allow for even small process variation. In other words, a queue is not automatically a mistake. The question is which queues are planned and which ones keep appearing at the same spot because something upstream is broken.
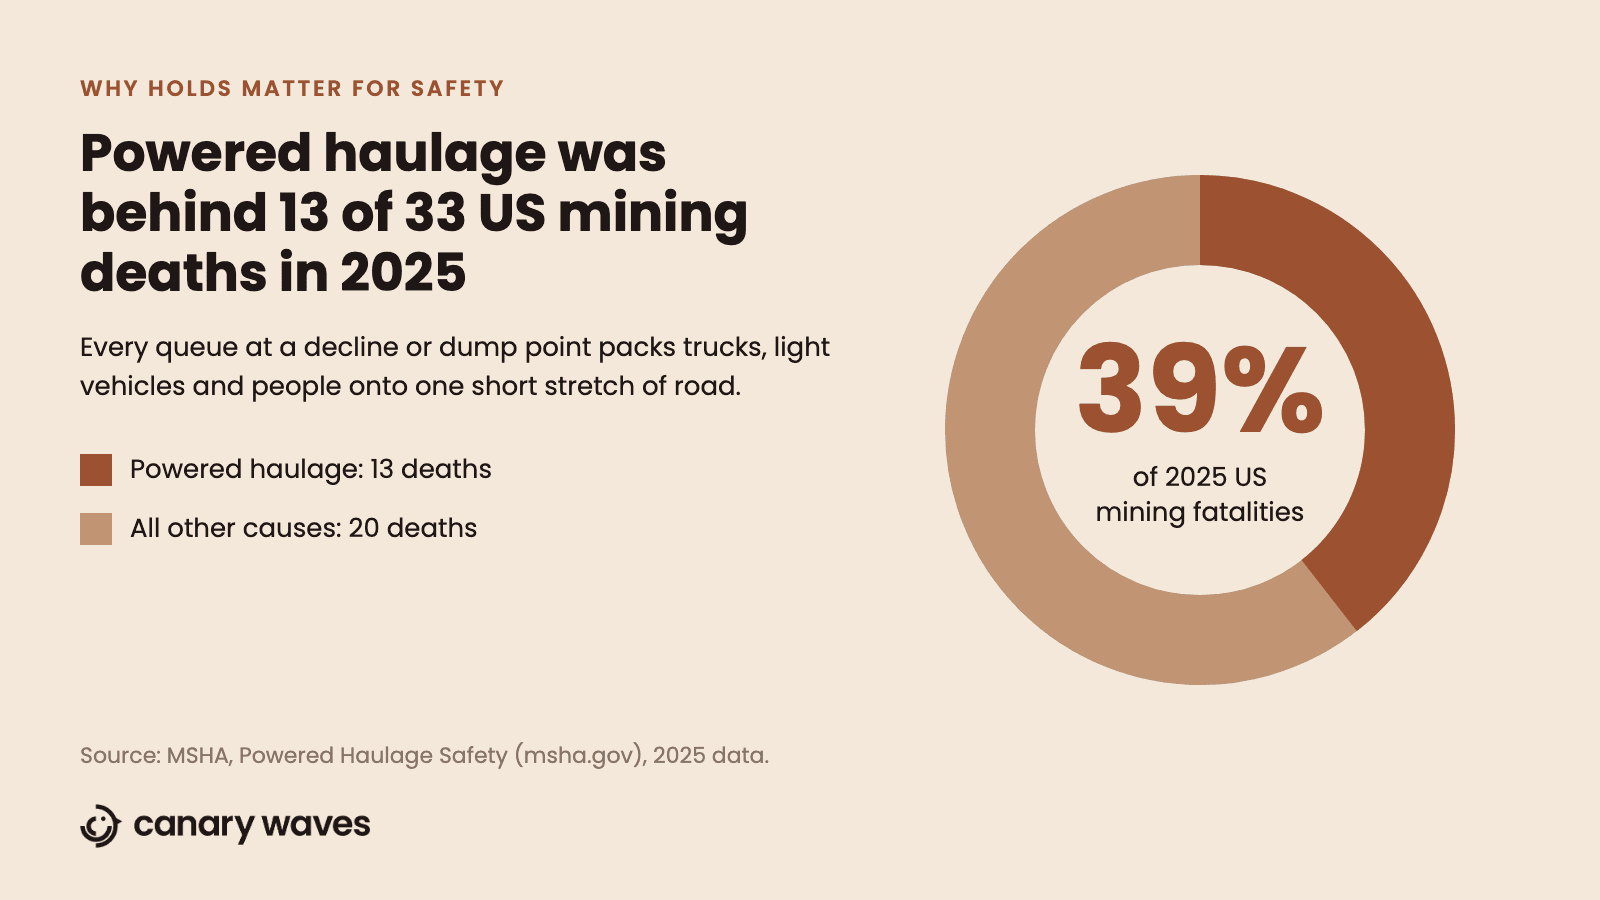
Queues concentrate risk. Powered haulage is consistently one of the biggest killers in US mining. According to MSHA's powered haulage safety page, powered haulage accidents accounted for 13 of the nation's 33 mining fatalities in 2025, or 39%, plus 426 nonfatal injuries. A hold point is where that equipment bunches up: loaded trucks waiting on a grade, empties stacking at a dump, a light vehicle trying to get past, a dozer working the tip. Every extra minute of queue is an extra minute of close interaction.
Communication is the weak link. In October 2024, the NSW Resources Regulator reported 46 vehicle interaction incident notifications in six months. Its review named two predominant causes: a lack of, or inadequate, communication between the people involved, and a lack of situational awareness on the part of operators. Congested haul roads are exactly where both get stretched. More trucks in one place means more calls on one channel and less time to hear each one.
Put those together and a hold call stops looking like admin. It is a timestamped, location-tagged report from the person best placed to see the problem. Without a record, there is no way of adding them up.
Signals to listen for on the radio
Operators report holds in short calls, not in summaries. When a constraint is building, these are the signals that start repeating:
- Holds at the same location. One hold is traffic. Holds from the same location every shift point to a design or scheduling problem.
- A second hold call from the same unit. It means the wait ran longer than the operator expected, and they are telling you.
- Queue lengths called in at a dump. A count of trucks waiting, said out loud, that never makes it into a report.
- Holds with a named cause. Waiting on the dozer, the grader or the loader. A stated cause is the most useful data point on the channel.
- Lightning holds. A site-wide stop. Necessary and non-negotiable, but it creates a pile-up when the hold lifts and everyone moves at once.
None of these are complaints. They are operators doing their job well, reporting status the way they were trained to. The trouble is that radio is built for the next sixty seconds, not for the next month. Once the transmission ends, the information is gone unless someone was writing it down.
Turning hold calls into a haul road congestion map
You do not need new technology to start seeing your bottlenecks. A practical sequence:
1. Count holds for one week, by location
Ask dispatch to keep a simple tally for five shifts: every hold call, where it was, roughly how long, and the stated reason if there was one. A clipboard works. So does a shared spreadsheet. You are not chasing precision. You are looking for the three or four locations that show up again and again.
2. Split holds into planned and unplanned
Some holds are designed in: one-way sections, a single-lane decline, the queue you expect at a shovel when the fleet is sized for it. Others are symptoms: a dump with one working tip because the dozer is shared, a bypass that keeps closing, a pass point with poor sightlines that makes operators wait longer than they need to. Only the second group is a fix list.
3. Compare day shift and night shift
If the same decline backs up on both shifts, the cause is probably physical: grade, width, road surface, a pinch point. If it only backs up on one, look at how that crew is dispatched, staffed or briefed. Same location, different cause, different fix.
4. Bring operators into the review
Operators know why they are holding. Five minutes at a pre-start asking where they waited longest this week, and why, can tell you what fleet data does not. It also makes clear that the goal is fixing the road, not blaming the driver.
5. Link holds to everything else
Holds connect to other signals. On the operation we analyzed, the trucks held longest in queues were the same trucks throwing overheating warnings hours later. We wrote that story up in When Congestion Cooks the Fleet. Closures and reroutes feed new queues too, which is the subject of 16 Route Diversions in 5 Days. And when the queues peak, so does near-miss language on the radio, covered in Stress on the Radio. Look at holds next to maintenance and incident data, not in a separate folder.
6. Fix one point, then measure again
Pick the worst location, change one thing (add a second tip, widen a passing bay, adjust the dozer schedule, retime the shovel move), and count holds again the following week. If the calls drop, you have a result you can show. If they move to the next decline down, you have found the real constraint.
Where Canary Waves fits
The manual tally works, but it is hard to keep going past a week and it only catches what dispatch has time to write down. Canary Waves connects passively to your existing two-way radio, transcribes the traffic with a model tuned to site slang and equipment names, and tags every hold by location, unit, shift and stated cause. Leaders get a shift-level view of where the real constraints are, with no new hardware and nothing new for operators to do. You can see the kinds of signals we surface on our main site.
The calls are already being made. The question is whether anyone is counting them.
See the signals we'd surface from a typical shift on your site. Book a 30-minute walkthrough.
FAQ
What causes haul road congestion in mines?
Usually a handful of fixed constraints: single-lane declines, dump points with one working tip, shared support equipment like dozers and graders, closed bypasses, and weather holds such as lightning. Fleet size matters too. Adding trucks past the point the loaders and dumps can handle turns spare capacity into queues rather than tonnes.
Is some truck queuing normal?
Yes. A 2014 AusIMM simulation study found the fleet size that maximizes productivity and value still leaves some trucks queuing at shovels on average, once normal variation is included. The goal is not zero queues. It is knowing which queues are planned and which keep appearing at the same spot because something upstream needs fixing.
How can I measure haul road congestion without new technology?
Have dispatch tally every hold call for one week: location, rough duration and stated reason. Sort by location and shift. The three or four points that show up repeatedly are your bottleneck map. Then ask operators at pre-start why they wait there, fix one point, and count again the following week.
Why does haul road congestion matter for safety?
Queues bunch heavy equipment, light vehicles and people into short stretches of road, which raises the number of close interactions. MSHA reports powered haulage accounted for 39% of US mining fatalities in 2025. Regulators also cite poor communication and low situational awareness as leading causes of vehicle interactions, both of which get harder in a crowded pit.
What do "holding" calls tell a mine that fleet data doesn't?
Fleet systems show that a truck stopped. The radio often says why: waiting on the dozer, three trucks ahead at the dump, a blocked decline, a lightning hold. That stated cause turns a stopped truck into a fixable problem. Captured across every shift, those calls build a bottleneck map in the operators' own words.